Showing posts with label Bubble Map. Show all posts

01 November 2010

🔖Knowledge Representation: Knowledge Maps (Part IV: Associations)

Associations, in several contexts called relations, are links between concepts, and even if they are labeled or not, explicit or implicit, they have assigned a meaning too. The split between concepts and labels introduces  two perspectives:
1. Knowledge broken down to concepts in which some of the concepts function as associations between other concepts.
2. Represented knowledge broken down as labels in which some of the labels function as associations between other labels.

A simple example of association is the one implied by the object agent verb (OAV) construct, also called the object subject verb (OSV), that stands not only at the base of linguistics topology but also at the base of RDF triples (in this context referred as subject-predicate-object, concept-connection-concept or ‘entity-event-entity’) rooted in the linguistics topology. Such constructs are the “is-a” and “has-a” constructs, often used in knowledge representation. For example “whale is a sea mammal” could be expressed as (“whale”, “is-a”, “sea mammal”) and “whale has a tail” as (“whale”, “has-a’, “tail”) in (subject, predicate, object) notation, however representing knowledge as such triples is not an easy task, but the visual representation of such triples with nodes and links reduces the complexity to some degree.

 KM - example 1

The domain knowledge could be relatively expressed as such isolated triples, but in knowledge representation, in order to reduce the complexity of visualization and navigation, it’s simpler to join such triples when they have common concepts. Thus the two triples could be represented as follows:

KM - example 2
 
The arrow shows in this case the agent, the first label in the sequence being the subject, while the label in between being the predicate. There are maps that don’t make use of arrows, in some cases the radial flow expressing the direction like in the case of Mind Maps, and maps in which there is no direction implied or a bidirectional row implies a bidirectional association, as in the case of synonymy.

The use of arrows and adequate labeling boxes facilitates KM’s understanding, in what concerns the role of labels in a triple, and navigation, in what concerns the flow/direction. As can be seen from the last diagram a subject could be involved in multiple associations, in the same way an object or predicate could be involved in multiple associations too. In the next KM could be observed for example how the same predicated is involved in multiple associations describing the anatomy of a whale.


KM - example 3 whale
Whale Knowledge Map (adapted after whale anatomy)


The original representation could function as a K-map as well, though images are more difficult to process than the maps built with adequate software, the later offering also the possibility of conversion to a portable format that could be further processed. In addition the spatial disposition of concepts could play a role as well, in this case being correlated with the disposal within whale’s anatomy. In more complex KMs the use of “background” images is not always easy to embed, in addition the multitude of connections increasing the overall complexity. The form of representation could depend on each person’s preferences, the association could be explicit as well as implicit, and typically only one of them is use. Here are the same “has-a” associations represented with the help of circle map (implicit associations) and bubble map (explicit associations).

KM - whale - bubble map KM - whale - circle map
Bubble map Circle Map

The “is-a” and “has-a” associations are used in combination with any other types of associations, of importance being especially the causality (A causes B), synonymy (A is synonym of B) or antonymy (A is antonym of B), precedence (A precedes B) or concomitance (A occurs at the same time as B), etc. In fact any verb, substantive or even prepositions could play in theory the role of an association. If the above examples fall in the “verb as association” category, the use of substantives as associations is maybe more difficult to intuit, so here is an example based on whale’s anatomy in which the “has-a” has been replaced with “anatomic part” association:

 KM - whale - substantive association
Between two concepts there could be in theory multiple associations, more than one explicit association, though few are such cases because typically is stressed only the most important/relevant association. In the below image, a part of a KM on “self-transcending knowledge”, could be seen how the “competitive advantage” is involved in two associations with the same concept.

KM - example 4Self-transcending knowledge KM part (KM based on [1] text)

The existence of multiple associations has several other implications in what concerns associations’ type. For example causality implies two inverse associations: “A causes B”, respectively “B caused by A”, in fact dealing with the same meaning associated in different directions by inversion of terms. Such constructs could be confusing, therefore a good practice is to adopt only one of the two associations; the simplest approach is to simply use “A causes B”. A similar type of association is the transposed association, in which from “A imply B” is inferred that “Not-B imply Not-A”. With this we entered in the territory of deductive reasoning, entailment and of rules of inference

Deductive reasoning could prove to be quite complex and of great use, especially when is intended to infer new associations (inferred associations) based on an existing set of associations. For example if in a KM we have that “A implies B” and “B implies A”, then we could deal with the equivalent association “A equivalent to B”, in mathematical terms expressed as “A=B”. Another simple logical inference is based on the simple rule of inference: if “A imply B” and “B imply C”, then “B imply C”. Implication could be applied also to causality, synonymy and several other types of associations.

The fact is that many of the rules of inference that apply is deductive reason could be used to KMs too, special inference engines could be used for this purpose. Associations between two or more concepts don’t have to be of the same type in order to prove to be useful, or in some cases even if the association seems to be of different types, the meaning they carry could be sufficient to allow an association to participate in inferences, this being valid especially for the associations belonging to the same class of meaning. In addition, associations of the same type and the concepts involved could reveal interesting properties that could be analyzed from the perspective of (superior) algebra or network theory.

Cardinality of Associations

The above representations have one important issue - they don’t reflect the cardinality of concepts, how many elements of the same concept participate in the associations. For example the whale has two blowholes and two pectorial fins, while a table has for legs, etc.  In database modeling the associations, actually called relations, include the cardinality (e.g. 1-to-1, 1-to-n, n-to-n) though it just highlights that there is one or multiple records/entities associated in relations. In our case is typically required to specify the actual cardinality. As database model could be regarded as KM too, it’s thus necessary to address both types of cardinality, when they apply.

References:
[1] A. Kaiser, B. Fordinal. (2010). Creating a ba for generating self-transcending knowledge. Journal of Knowledge Management.Vol.14, no. 6 [Online] 10.1108/13673271011084943

17 July 2009

🔖Knowledge Representation: Thinking Maps

Introduction

Dr. D. Hyerle grouped under Thinking Maps syntagm a set of eight metacognitive visual tools rooted in the eight cognitive skills: defining in context, describing attributes, comparing and contrasting, classification, part-whole spatial reasoning, sequencing, cause and effect reasoning, and reasoning by analogy [1]. He used the tools to create a easy to use language for learning and information representation, the eight graphic primitives can be used in an infinite of ways. There are several diagrams which summarize what the eight Maps are about:

Thinking Maps [8] Thinking Maps [9]


    Benefits associated with the use of Thinking Maps can be found in [3], [11] and [2] together with modes of employment.

Circle Maps

Circle Maps are used to place concepts into a context with the help of two concentric circles, the smaller one containing the context, while in the outer circle are placed the associated concepts, acting like properties or association bag. Concepts are usually clustered without creating explicit relations between them, more complex Circle Maps being created using multiple concentric circles, a target diagram according to [12], or by partitioning the outer circle, creating thus different spheres of meaning.

Given its geometrical properties (e.g. centricity, equidistance, regularity), the circle is a perfect tool for representations, though it doesn’t have to be used as a leitmotif; triangles, squares, rectangles or any other regular polygons can be used for the same purpose, especially when additional intrinsic characteristic are highlighted, for example trinity, square of opposition, n-tuplicity, etc.

Circle Maps can be pretty simplistic, in simplicity residing their beauty and use; overall Circle Maps are a perfect tool to introduce concepts, especially in primary school. Their importance should not be underestimated, they can have strong representational power especially when used in combination with other representational patterns.

Bubble Maps

Bubble Maps focus on direct associations between a concept and its descriptors, also called adjectives, qualities, attributes or characteristics [11]. Such representations are integrant part of many types of Maps that represent associations explicitly (e.g. Mind Maps, Concept Maps). Extensively, a Bubble Map could be used for the same representations as Circle Maps, allowing thus explicit associations between a concept and its attributes, same it can include other part of speech, concepts or fragments of text. For greater effect, Bubble Maps could be combined with Circle Maps, especially when needed to highlight different boundaries.

Double Bubble Maps

Double Bubble Maps are used for comparing and contrasting the descriptors of two concepts. Another popular tools used for the same purpose are the Venn diagrams, which mixes some of the characteristics of Circle Maps and Double Bubble Maps, though they are sometimes more complex to use and, in plus, they allow the comparison of multiple concepts. Are few the situations in which more than two concepts need to be compared, how should such a Map be called?! Maybe Multi-Bubble Maps…

Flow Map

Most probably many people are already familiar with flowcharts or flow diagrams, one of the process diagrams used to model the flow of processes (systems), and sometimes considered synonym to them. Hyerle’s Flow Map seems to be slightly different than the flow diagrams used to model processes, and even if both maps are based on sequencing and ordering principle, the later seems to be more complex and use more representational elements, containing symbols for decision, delays, predefined subprocesses or data input/output. Hyerle’s Flow Map resumes only at presenting information in sequencing and ordering manner, being capable of represent for example a linear causality sequence or the points on a scale (e.g. past, present, near future, future or very cold, cold, warm, very warm). I consider scales, also named continuums by [12], a pattern of its own, used to represent a set of ordered concepts, including timelines, transition between two states, scales of values, ordered sets, etc. It is possible to represent together two or more scales/continuums within the same system of coordinates, each scale on an axis of its own. Such a system is called a crossed continuum by [12] and conceptual space by [13].

Multi-Flow Maps

A Multi-Flow Map is obtained by combining more than one Flow Maps, creating parallel or intersected sequences. Therefore they are useful to represent causes and effects diagrams, more like the well-known Fishbone diagram, the distinction residing in the fact that the multi-flow Maps not necessarily follow a hierarchical structure, multiple effects being possible. In addition the Fishbone diagram has a “methodology” of its own, the causes being identified starting from an observed effect.

It’s interesting that [10] makes distinction between Multiple Causes Maps and Multiple Effects, which could be taken as particular Multi-Flow Maps.

Brace Maps and Tree Maps

Brace Maps are the only type of Maps I often saw used in manuals or other type of books, usually for detailing the parts of concepts allowing thus to analyze the parts of a concept and the concept itself. Brace Maps are used also for the classification and grouping of concepts, in Hyerle’s system usually represented using Tree Maps.

I often used Brace Maps in Mathematical definitions, when the definitions need to be split in parallel threads (left braces), or demonstrations, when multiple threads flow into the final result (right). Even the use is slightly different the principle is somehow similar.

Bridge Maps

Bridge Maps are used for highlighting analogies between concepts into an inversed Vee-like diagram, which can be repeated for each additional analogy added to the chain, with the comparison concepts on top and the relating factors below. Bridge Maps can be used not only for simple analogies, but also for metaphors.     I expect that in case are needed to be compared multiple related factor types for the same concepts, then it will be created one Bridge Map for each factor type. For such scenarios a simple table could be a better choice, in which the compared concepts form the headers, while the related factors are the actual records. Even more, the concept representing the concept type can be added too, forming a matrix. An example of such matrix can be found in a previous posting on Web’s evolution.     Even if the use of Bridge Maps expresses directly the intent of representing analogies, I find tables or matrixes much simpler to use and non-redundant.

New Patterns, Old Patterns

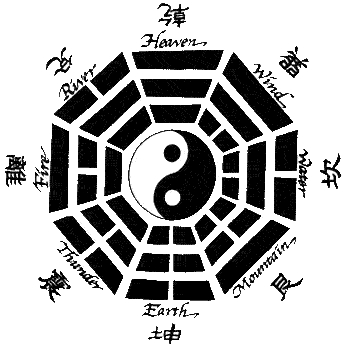
The patterns encompassed in Thinking Maps are not new, many of them have been used a few centuries ago, as can be seen from the below examples. In the first figure can be seen the Buenting clover leaf map, woodcut made in 1581 in Megdeburg; it can be regarded as a combination between Circle Map and Bubble Map. In the second figure from Athanasius Kircher’s Oedipus Aegyptiacus can be seen a wonderful complex diagram of the names of God, a combination of a partitioned target diagram (multi-concentric Circle Maps) and Tree Maps. In the third figure, a simple I Chin diagram based on Pa Gua trigrams, a partitioned Circle Map making use of symbols, the same theme being present also in the fourth diagram, which evolves the I Ching model to a representation of the DNA world.

Buenting clover leaf map Athanasius Kircher’s Oedipus Aegyptiacus
Buenting clover leaf map [6] Athanasius Kircher’s Oedipus Aegyptiacus [14]


I Ching DNA/RMA Mandala
I Ching [4] DNA/RNA Mandala [5]


References:

[1] Hyerle, D. (2008). Thinking Maps®: A Visual Language for Learning. In: Thinking Maps®: A Visual Language for Learning, ISBN: 978-1-84800-149-7. [Online] Available from: http://www.springerlink.com/content/x57121720731381j/ (Accessed: 23 June 2009)
[2] A. Costa, P. Wolfe, H. Gardner, D. Goldman. The Networking Brain and Mind. [Online] Available from: http://www.mapthemind.com/pdf/visual_tools/visual_tools_CH2_20_35.pdf (Accessed: 7 July 2009)
[3] Learning Prep School. Thinking Maps. [Online] Available from: http://www.learningprep.org/thinkingmaps.htm (Accessed: 7 July 2009)
[4] Zen’s Sekai I. (2007). I Ching. [Online] Available from: http://zensekai.wordpress.com/2007/04/05/i-ching/ (Accessed: 8 July 2009)
[5] The Abysmal. (2006). DNA Codon Mandala. [Online] Available from: http://theabysmal.wordpress.com/2006/07/15/dna-codon-mandala/ (Accessed: 8 July 2009)
[6] Learn NC. Buenting clover leaf map. [Online] Available from: http://www.learnnc.org/lp/multimedia/6981
[7] L. Sachar. Multiple Mapping: Holes. [Online] Available from: http://www.learningprep.org/images/thinkingmaps_album/student_work_images/mult_mapping_holes_louis.JPG (Accessed: 12 July 2009)
[8] Seattle Schools. Thinking Maps. [Online] Available from: http://www.seattleschools.org/area/arts/visualarts/thi_map.html (Accessed: 13 July 2009)
[9] SaskEd. Unit Five: Social Development. [Online] Available from: http://www.sasked.gov.sk.ca/docs/native30/nover5.html (Accessed: 13 July 2009)
[10] Somers Central School District. ????. Graphic Organizers that Support Specific Thinking Skills. [Online] Available from: http://www.somers.k12.ny.us/intranet/skills/thinkmaps.html (Accessed: 14 July 2009)
[11] Hyerle. D. (2000) Thinking Maps® for Reading Minds. In: A Field Guide to Using Visual Tools. Association for Supervision & Curriculum Deve. ISBN: 978-0871203670. [Online] Available from: http://www.mapthemind.com/PDF/visual_tools/visual_tools_CH6_100_123.pdf (Accessed: 14 July 2009)
[12] G. Petty. (2009). ISBN: 978-1-4085-0452-9. Evidence Based Teaching: A Practical Approach. 2nd Ed. [Online] Available from: http://bookshop.blackwell.co.uk/extracts/evidence_based_teaching.pdf (Accessed: 16 July 2009)
[13] Gaerdenfors, P. (2000). Conceptual Spaces: The Geometry of Thought. Massachusetts Institute of Technology. ISBN: 0-262-07199-1.
[14] Cramer, F (2005) Computations of Totality. In: Words Made Flesh – Code, Culture, Imagination. Piet Zwart Institute. [Online] Available from: http://pzwart.wdka.hro.nl/mdr/research/fcramer/wordsmadeflesh/03-chapter_2/ (Accessed: 16 July 2009)
Related Posts Plugin for WordPress, Blogger...