17 July 2009

🔖Knowledge Representation: Thinking Maps

Introduction

Dr. D. Hyerle grouped under Thinking Maps syntagm a set of eight metacognitive visual tools rooted in the eight cognitive skills: defining in context, describing attributes, comparing and contrasting, classification, part-whole spatial reasoning, sequencing, cause and effect reasoning, and reasoning by analogy [1]. He used the tools to create a easy to use language for learning and information representation, the eight graphic primitives can be used in an infinite of ways. There are several diagrams which summarize what the eight Maps are about:

Thinking Maps [8] Thinking Maps [9]


    Benefits associated with the use of Thinking Maps can be found in [3], [11] and [2] together with modes of employment.

Circle Maps

Circle Maps are used to place concepts into a context with the help of two concentric circles, the smaller one containing the context, while in the outer circle are placed the associated concepts, acting like properties or association bag. Concepts are usually clustered without creating explicit relations between them, more complex Circle Maps being created using multiple concentric circles, a target diagram according to [12], or by partitioning the outer circle, creating thus different spheres of meaning.

Given its geometrical properties (e.g. centricity, equidistance, regularity), the circle is a perfect tool for representations, though it doesn’t have to be used as a leitmotif; triangles, squares, rectangles or any other regular polygons can be used for the same purpose, especially when additional intrinsic characteristic are highlighted, for example trinity, square of opposition, n-tuplicity, etc.

Circle Maps can be pretty simplistic, in simplicity residing their beauty and use; overall Circle Maps are a perfect tool to introduce concepts, especially in primary school. Their importance should not be underestimated, they can have strong representational power especially when used in combination with other representational patterns.

Bubble Maps

Bubble Maps focus on direct associations between a concept and its descriptors, also called adjectives, qualities, attributes or characteristics [11]. Such representations are integrant part of many types of Maps that represent associations explicitly (e.g. Mind Maps, Concept Maps). Extensively, a Bubble Map could be used for the same representations as Circle Maps, allowing thus explicit associations between a concept and its attributes, same it can include other part of speech, concepts or fragments of text. For greater effect, Bubble Maps could be combined with Circle Maps, especially when needed to highlight different boundaries.

Double Bubble Maps

Double Bubble Maps are used for comparing and contrasting the descriptors of two concepts. Another popular tools used for the same purpose are the Venn diagrams, which mixes some of the characteristics of Circle Maps and Double Bubble Maps, though they are sometimes more complex to use and, in plus, they allow the comparison of multiple concepts. Are few the situations in which more than two concepts need to be compared, how should such a Map be called?! Maybe Multi-Bubble Maps…

Flow Map

Most probably many people are already familiar with flowcharts or flow diagrams, one of the process diagrams used to model the flow of processes (systems), and sometimes considered synonym to them. Hyerle’s Flow Map seems to be slightly different than the flow diagrams used to model processes, and even if both maps are based on sequencing and ordering principle, the later seems to be more complex and use more representational elements, containing symbols for decision, delays, predefined subprocesses or data input/output. Hyerle’s Flow Map resumes only at presenting information in sequencing and ordering manner, being capable of represent for example a linear causality sequence or the points on a scale (e.g. past, present, near future, future or very cold, cold, warm, very warm). I consider scales, also named continuums by [12], a pattern of its own, used to represent a set of ordered concepts, including timelines, transition between two states, scales of values, ordered sets, etc. It is possible to represent together two or more scales/continuums within the same system of coordinates, each scale on an axis of its own. Such a system is called a crossed continuum by [12] and conceptual space by [13].

Multi-Flow Maps

A Multi-Flow Map is obtained by combining more than one Flow Maps, creating parallel or intersected sequences. Therefore they are useful to represent causes and effects diagrams, more like the well-known Fishbone diagram, the distinction residing in the fact that the multi-flow Maps not necessarily follow a hierarchical structure, multiple effects being possible. In addition the Fishbone diagram has a “methodology” of its own, the causes being identified starting from an observed effect.

It’s interesting that [10] makes distinction between Multiple Causes Maps and Multiple Effects, which could be taken as particular Multi-Flow Maps.

Brace Maps and Tree Maps

Brace Maps are the only type of Maps I often saw used in manuals or other type of books, usually for detailing the parts of concepts allowing thus to analyze the parts of a concept and the concept itself. Brace Maps are used also for the classification and grouping of concepts, in Hyerle’s system usually represented using Tree Maps.

I often used Brace Maps in Mathematical definitions, when the definitions need to be split in parallel threads (left braces), or demonstrations, when multiple threads flow into the final result (right). Even the use is slightly different the principle is somehow similar.

Bridge Maps

Bridge Maps are used for highlighting analogies between concepts into an inversed Vee-like diagram, which can be repeated for each additional analogy added to the chain, with the comparison concepts on top and the relating factors below. Bridge Maps can be used not only for simple analogies, but also for metaphors.     I expect that in case are needed to be compared multiple related factor types for the same concepts, then it will be created one Bridge Map for each factor type. For such scenarios a simple table could be a better choice, in which the compared concepts form the headers, while the related factors are the actual records. Even more, the concept representing the concept type can be added too, forming a matrix. An example of such matrix can be found in a previous posting on Web’s evolution.     Even if the use of Bridge Maps expresses directly the intent of representing analogies, I find tables or matrixes much simpler to use and non-redundant.

New Patterns, Old Patterns

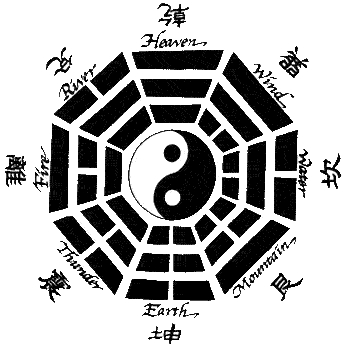
The patterns encompassed in Thinking Maps are not new, many of them have been used a few centuries ago, as can be seen from the below examples. In the first figure can be seen the Buenting clover leaf map, woodcut made in 1581 in Megdeburg; it can be regarded as a combination between Circle Map and Bubble Map. In the second figure from Athanasius Kircher’s Oedipus Aegyptiacus can be seen a wonderful complex diagram of the names of God, a combination of a partitioned target diagram (multi-concentric Circle Maps) and Tree Maps. In the third figure, a simple I Chin diagram based on Pa Gua trigrams, a partitioned Circle Map making use of symbols, the same theme being present also in the fourth diagram, which evolves the I Ching model to a representation of the DNA world.

Buenting clover leaf map Athanasius Kircher’s Oedipus Aegyptiacus
Buenting clover leaf map [6] Athanasius Kircher’s Oedipus Aegyptiacus [14]


I Ching DNA/RMA Mandala
I Ching [4] DNA/RNA Mandala [5]


References:

[1] Hyerle, D. (2008). Thinking Maps®: A Visual Language for Learning. In: Thinking Maps®: A Visual Language for Learning, ISBN: 978-1-84800-149-7. [Online] Available from: http://www.springerlink.com/content/x57121720731381j/ (Accessed: 23 June 2009)
[2] A. Costa, P. Wolfe, H. Gardner, D. Goldman. The Networking Brain and Mind. [Online] Available from: http://www.mapthemind.com/pdf/visual_tools/visual_tools_CH2_20_35.pdf (Accessed: 7 July 2009)
[3] Learning Prep School. Thinking Maps. [Online] Available from: http://www.learningprep.org/thinkingmaps.htm (Accessed: 7 July 2009)
[4] Zen’s Sekai I. (2007). I Ching. [Online] Available from: http://zensekai.wordpress.com/2007/04/05/i-ching/ (Accessed: 8 July 2009)
[5] The Abysmal. (2006). DNA Codon Mandala. [Online] Available from: http://theabysmal.wordpress.com/2006/07/15/dna-codon-mandala/ (Accessed: 8 July 2009)
[6] Learn NC. Buenting clover leaf map. [Online] Available from: http://www.learnnc.org/lp/multimedia/6981
[7] L. Sachar. Multiple Mapping: Holes. [Online] Available from: http://www.learningprep.org/images/thinkingmaps_album/student_work_images/mult_mapping_holes_louis.JPG (Accessed: 12 July 2009)
[8] Seattle Schools. Thinking Maps. [Online] Available from: http://www.seattleschools.org/area/arts/visualarts/thi_map.html (Accessed: 13 July 2009)
[9] SaskEd. Unit Five: Social Development. [Online] Available from: http://www.sasked.gov.sk.ca/docs/native30/nover5.html (Accessed: 13 July 2009)
[10] Somers Central School District. ????. Graphic Organizers that Support Specific Thinking Skills. [Online] Available from: http://www.somers.k12.ny.us/intranet/skills/thinkmaps.html (Accessed: 14 July 2009)
[11] Hyerle. D. (2000) Thinking Maps® for Reading Minds. In: A Field Guide to Using Visual Tools. Association for Supervision & Curriculum Deve. ISBN: 978-0871203670. [Online] Available from: http://www.mapthemind.com/PDF/visual_tools/visual_tools_CH6_100_123.pdf (Accessed: 14 July 2009)
[12] G. Petty. (2009). ISBN: 978-1-4085-0452-9. Evidence Based Teaching: A Practical Approach. 2nd Ed. [Online] Available from: http://bookshop.blackwell.co.uk/extracts/evidence_based_teaching.pdf (Accessed: 16 July 2009)
[13] Gaerdenfors, P. (2000). Conceptual Spaces: The Geometry of Thought. Massachusetts Institute of Technology. ISBN: 0-262-07199-1.
[14] Cramer, F (2005) Computations of Totality. In: Words Made Flesh – Code, Culture, Imagination. Piet Zwart Institute. [Online] Available from: http://pzwart.wdka.hro.nl/mdr/research/fcramer/wordsmadeflesh/03-chapter_2/ (Accessed: 16 July 2009)

03 July 2009

🔖Knowledge Representation: Knowledge Representation in Antiquity

 I’m fascinated by the techniques and tools used for Knowledge Representation, especially the ones used in the past, centuries and even thousands of years before. Somebody was saying that nothing is new under the sky, everything existed before, even if it was in a more archaic form of expression, the simplicity doesn’t diminish the importance.

My fascination is somehow correlated to the fact that many of the representations that can be catalogued under Knowledge Representation are related to philosophical and religious believes, two of the domains that played an important role in the life of the spiritual man from antiquity. Oh, I forgot astronomy or, astrology if you want, the associations of stars in constellations, uniting the dots in a pattern that can be easier memorized and identified, can be considered maybe as a pseudo-technique for Knowledge Representation.

In my dissertation paper, in a short historical overview of Knowledge Representation structures used over time, I mentioned the Tree of Life representations on stone, ceramic or clay artefacts preserved until now from different cultures, the “arbor porphyriana” or “Porphyrian tree”, genealogical trees dated from 11th century, KRS like representation of Joachim of Fiore [1] or Ramon Llul [2], the Sephirotic Tree central to Jewish tradition, quipas and square of oppositions. Actually, the list of such representation is much bigger; I tried to point only the oldest sources in order to highlight the existence of various such representation techniques. I think that I could have talked more about some representations and add many more examples, though I don’t think it was nor the place and neither the time to do it, for some of them needing to do more research, given their interpretational richness. In the past two weeks I tried to do some research in this direction, I advanced a little in the subject though there is still a long way to go. I realized that for the moment would be impossible to approach the subject in a more structured and professional form, on subjects like the Tree of Life or Sephirotic Tree has been written many books and advanced many theories. As I am interested in the Kabbalistic and Hermetic traditions, some of the mentioned representations were not new to me, their richness of meaning intriguing me, this being also one of the reasons for which I chosen a topic for my dissertation paper related to Knowledge Representation.

The Sephirotic Tree is actually my first meaningful intersection with a KRS, giving it some thought over time, trying to understand the various interpretations, and believe me, there is a whole set of philosophies based on it. As Frater FP highlights, the Sephirotic Tree became a Meta-Map or Meta-Model for a Meta-System “capable of comprehending other systems within itself”, the Seven Rays and Chakra systems, the astrology itself and Tarot being examples of other meta-models [4]. It is actually interesting to study how such models were formed and evolved, unfortunately all we can is to launch in the blue other more or less fantastic theories. In many sources it is advanced the idea that the Jewish Sephirotic Tree derives from the Egyptian or Assyrian/Babylonian Tree of Life, theory proved by the antique artefacts found, though Trees of Life can be met also Indian or Nazca antic cultures, revealing the universality of such a symbol. These various tree representations could have in theory a unique source, though this supposes the existence of an older culture, why not the Atlanteans, though that’s maybe a little too much SF for this post, unlike you are open for such theories. If no such common source exists, then most probably exist something higher, a collective or archetypal consciousness, same as is possible that people arrived independently to the same truths, so there must be a correlation between the tree and the inner/outer world.

    Other religious representations are centred on trinity, the various types of crosses and shields of trinity being an example in this direction. The oldest shields of trinity I know of are the ones available in Cotton Faustina and Summa Vitiorum manuscripts from 13th century. A second type of representations was transmitted through the intermediary of seals and even coins, their means being lost in the past.

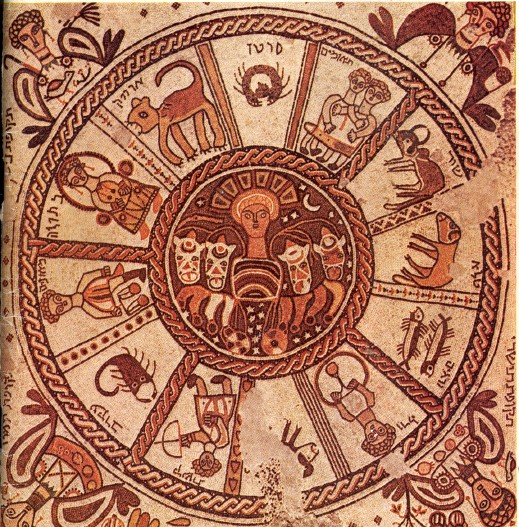
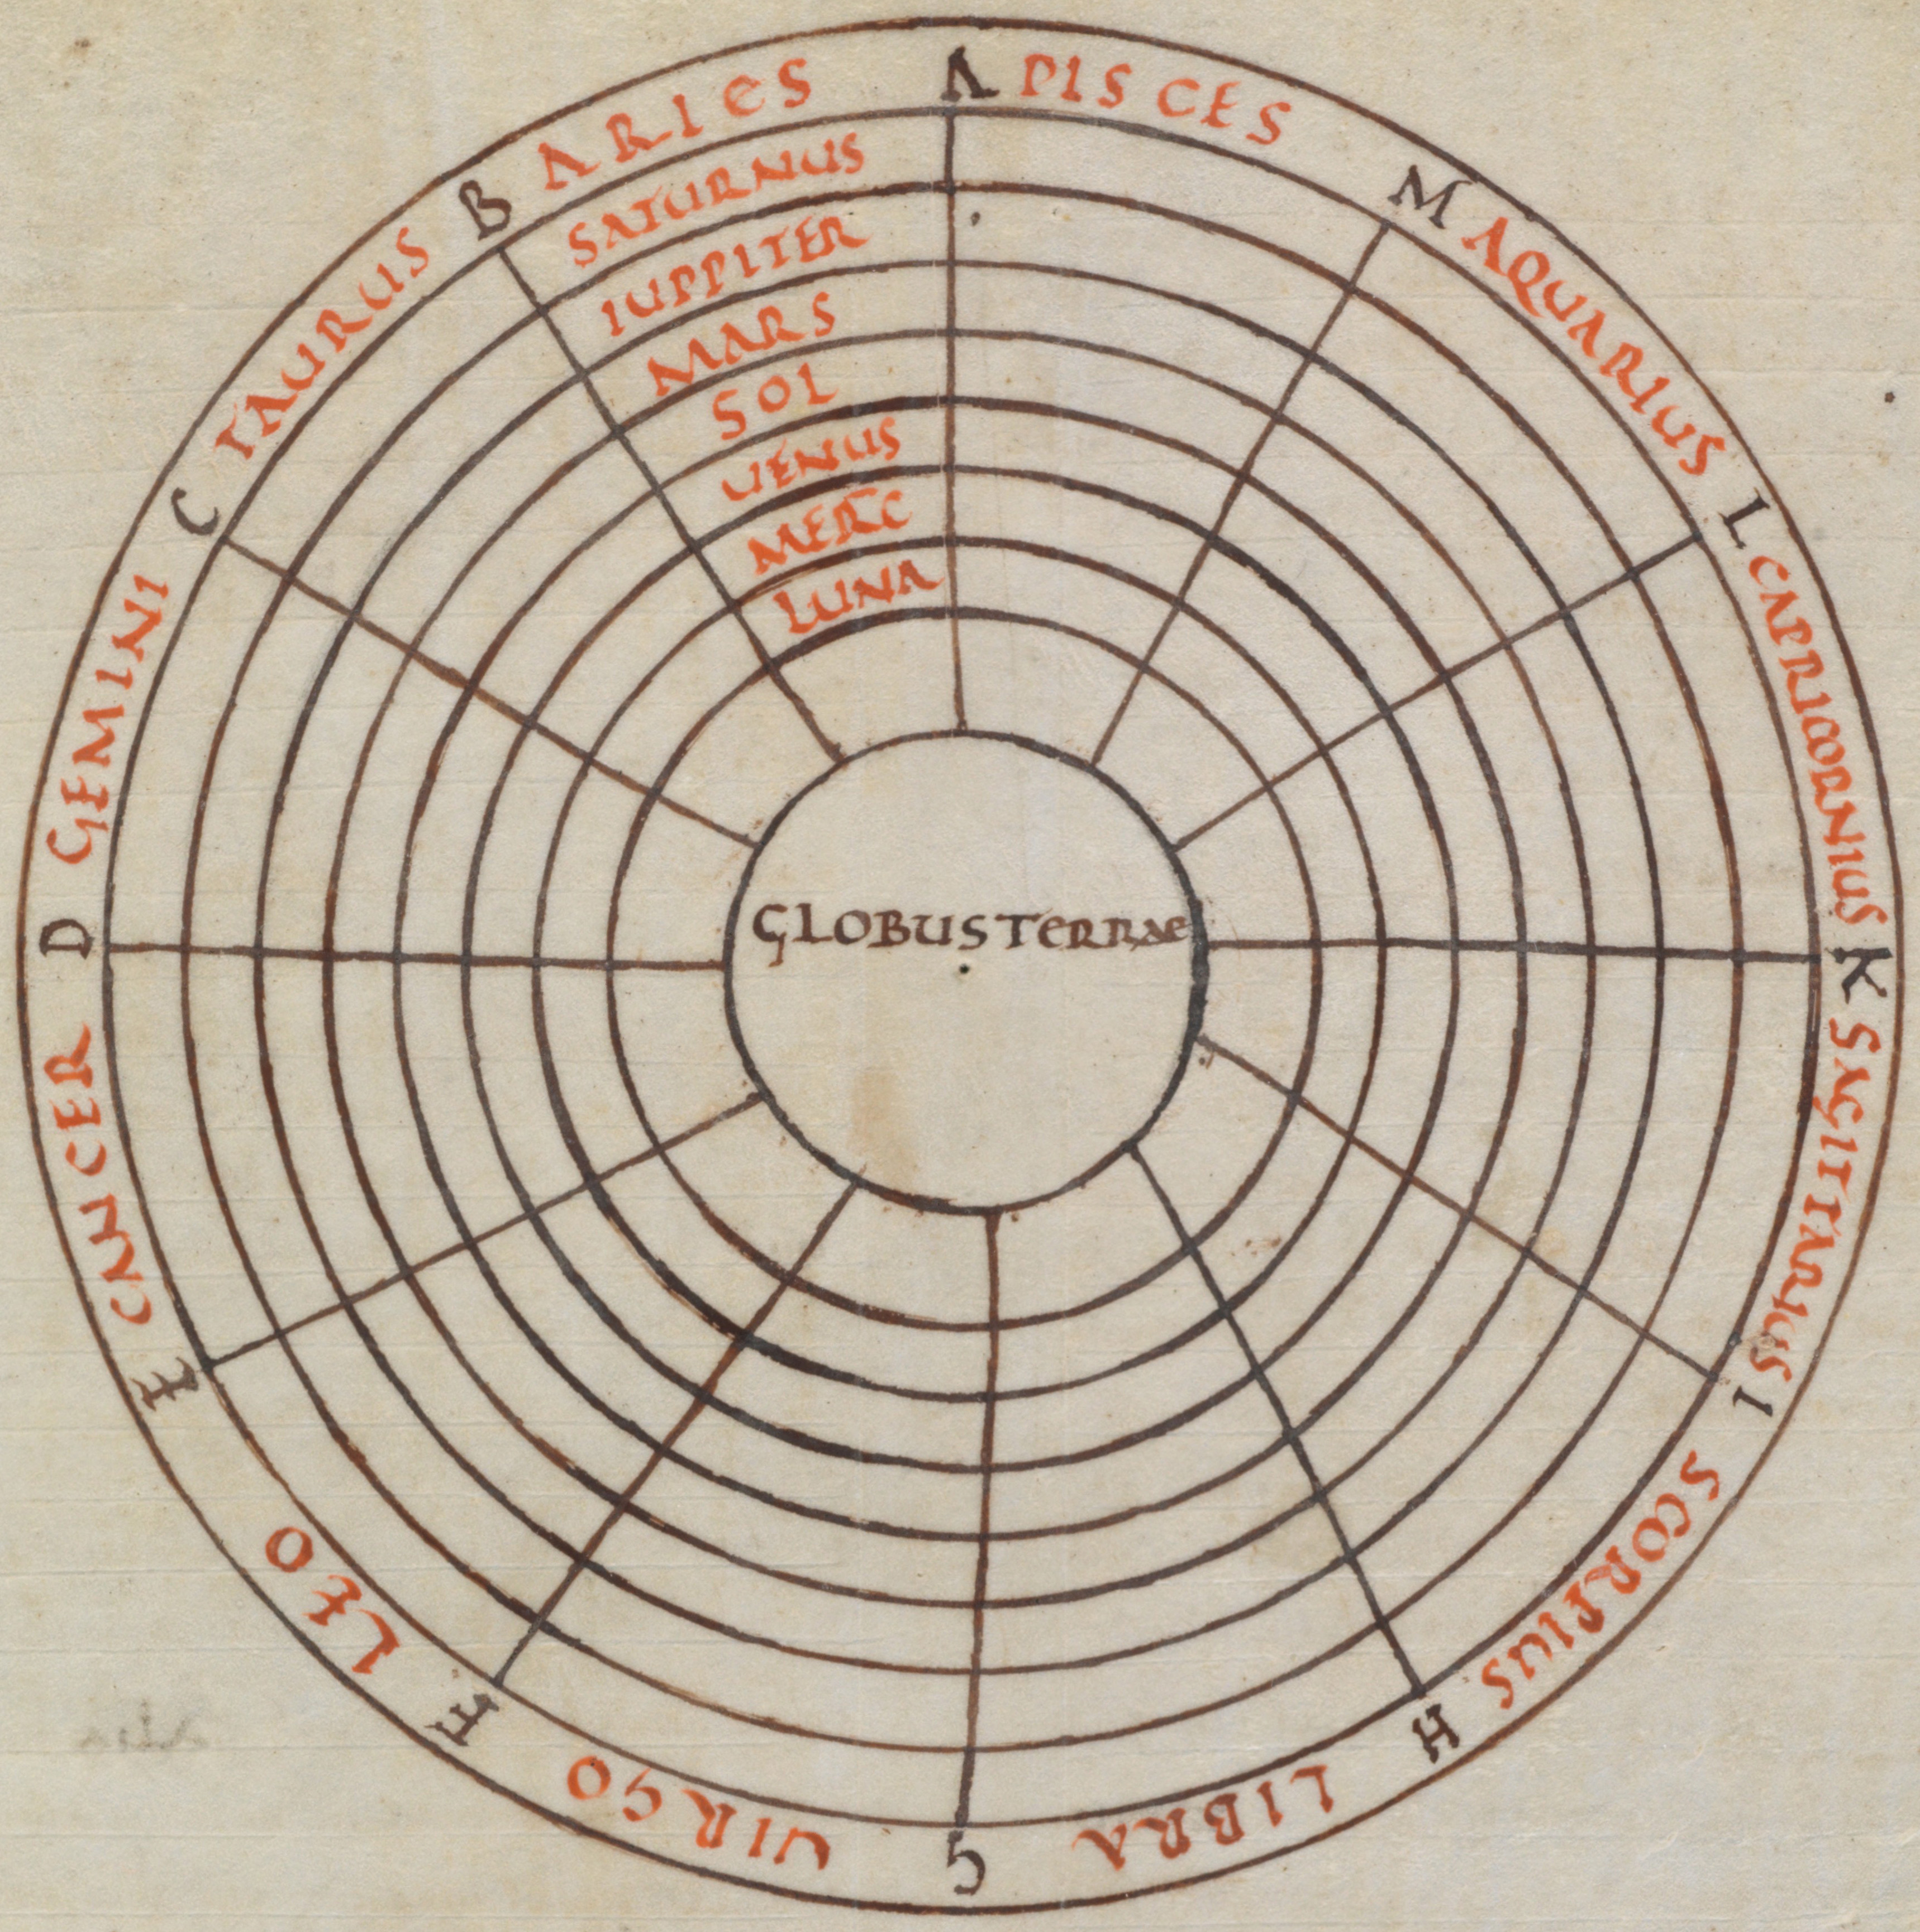
Zodiac [5] Macrobian cosmic diagram [6] Chinese chart [7]


As I previously mentioned, an important amount of knowledge was transmitted in relation to the stars, zodiacs like the ones present in a 6th century synagogue at Beit Alpha, Israel, cosmic diagrams like the Macrobian diagram from 9th century and sky charts like the Chinese one dated to 7th century seems to be common along the time. Such testimonies of the past are again present on all continents in various forms and styles. Now that we are approaching with rapid steps the year 2012, the end of the world or beginning of a new era after some interpreters of Mayan calendar, a hoax for others, based on moon’s natural cycle, the Mayan calendar spans over a range of 5125 years, between 3113 BC and 2012 AD; jumping over interpretations, it remains the beauty and abstractness of Mayan calendar representations.

Maya Calendars


It doesn’t makes sense to talk about Knowledge Representation in antiquity without mentioning, at least roughly, a masterpieces of Chinese thought, I Ching, the Book of Changes. Based on 64 hexagrams rooted in yin and yang principles, it presents a beautiful complex Meta-Model, hard to grasp by most of the mortals, and I’m one of them, at least for now.

References:
1. International Center for Joachimist Studies. (????). Joachim of Fiore. [Online] Available from: http://www.centrostudigioachimiti.it/Gioacchino/GF_Tavoleeng.asp (Accessed: 13 February 2009)
2. Cahill, M.J. 2005. Graphical Languages – History and Uses. Future Knowledge Group. [Online] Available from: http://www.futureknowledge.biz/Graphical%20Languages%20-%20History%20and%20Uses-1.1.pdf (Accessed: 8 January 2008)
3. S. Weigel. ????. Genealogy, On the iconography and rhetorics of an epistemological topos. Enciclopédia e Hipertexto. [Online] Available from: http://www.educ.fc.ul.pt/hyper/resources/sweigel/ (Accessed: 3 July 2009)
4. Frater FP. 2005. The Magician’s Kabbalah. [Online] Available from: http://www.scribd.com/doc/16605805/The-Magicians-Kabbalah (Accessed: 3 July 2009)
5. TutorGig. 2009. Astrology [Online] Available from: http://www.tutorgig.com/ed/Astrology (Accessed: 3 July 2009)
6. Wikipedia. 2009. Flat Earth. [Online] Available from: http://en.wikipedia.org/wiki/Flat_Earth (Accessed: 3 July 2009)
7. KIDIPEDE. 2009. Chinese Astronomy. [Online] Available from: http://www.historyforkids.org/learn/china/science/pictures/starmap.jpg (Accessed: 3 July 2009)

Technology x.0: Finally the Digital Book Reader - Part II

    One month is gone and I had a great time playing with my Sony Digital Reader – overall is a nice experience, reading in the evening before falling asleep became actually more pleasant, the reader weighting less than some of the books I’m having in my small library. As often I’m using the laptop only for reading electronic documents, the Reader helped me to reduce the number of hours spent In front of the laptop, and that’s quite a deal considering the huge amount of time I’m spending daily working on computer. The device proved to be also useful while using the medical bike, being much easier to fix it on the bike than a normal book.

    Excepting the creation of Knowledge Maps with Digital Readers disscussed in the previous post, on my wish list for future Reader devices and services appeared a few more points appeared since then:

    1. A dictionary that would show a definition or synonyms for the highlighted word. The existence of bilingual dictionaries would be a plus, a tool like Babylon on a reading device would be more than appreciated.

    2. The possibility to categorize notes, for example in key-words, concepts, quotes, unknown words, etc. This shouldn’t be limited to predefined categories, custom categories could be used in combination with predefined categories; the user for example could assign a set of categories to a set of buttons for faster response, thus not needing to select a category from a list each time the assignment is done.

    3. The possibility to save multiple bookmarks – now the device stores the last visited page, great thing, though if for example I click on saved notes, the previous bookmark is lost. This could be covered somehow in point 2, though I considered it deserves a place of its own in my list.

    4. Improved view/editing capabilities, right now there are cases in which the Reader fails to select the exact piece of text I want, most probably because of documents’ format, the same could be blame also for the strange display of text when increasing font’s size. This includes cross-page text selections – right now I find it quite difficult to select a text found on two consecutive pages.
    It won’t be bad if the files’ name and other metadata could be modified directly in Reader.

    5. Internet browsing and the possibility to save content on the local device, for beginning read-only capabilities for simple HTML Web pages would do, though, on the long run, it would be nice if a Digital Reader could dispose of read-write capabilities.

    6. A wider digital display to allow at least normal read of small-format books;

    7. A longer battery duration - because I’m using the stick to select text, the energy consume is higher, after a few hours being requested to recharge it. I wonder whether solar energy could be used to recharge Reader’s battery…

    8. Collaboration between content Vendors, right now vendors like Sony and Amazon providing content only for their products, on one side this strengthen their positions on the Readers’ market, though limits the accessibility to content consumers, market which could prove to be more profitable than the one of the Readers.

    9. Global services – I was quite disappointed when I wanted to buy a book and I couldn’t because Sony offers content only for the Canadian and US market. I understand that this is a new market which might not be mature enough, though I think that such Vendors should be a little more aggressive.

    10. Processing tools that allow processing the content created with Readers (e.g. Notes), exporting it for example to other types of files,

    I see the Digital Reader device playing a more important role in learning, not only simple reading, Reader Based Training (RBT) could have maybe the same impact on users as Computer Based Training (CBT) or Web Based Training (WBT) services, on a Reader being maybe more easier to consume such content.

20 June 2009

🔖Knowledge Representation: 3D Maps using 3D TopicScape Pro

Today I took the time and played with 3D TopicScape Pro, a nice 3D tool that can be used for Mind and Concept Mapping. 3D TopicScape Pro together with 3D TopicScape Lite, products of TopicScape, can be run on Windows 2000, XP and Vista.

From a first user experience the look and feel is interesting, the tool is easy to use and has a small learning curve, and it includes a few demos which make the learning process easier. The Landscaped Maps seems to be useful for representing several levels of children, though when the number of children is greater than 4-5, the labels are hard to see. The topics are represented as cones (see Figure 1) and to each topic can be attached up to 10 tags, the flagging of topics as important allows easier visual identification.

Learning Mind Map created with 3D TopicScape Pro Figure 1: Learning Mind Map created with 3D TopicScape Pro

The tool offers multiple views – home, full, top, tag pool and hit list, the later offering an historical list of Map’s elements (see Figure 2). It includes several skins, rich editing and configuring features that add a plus to overall usability.

Hit List for the above Mind Map Figure 2: Hit List for the above Mind Map

Frankly I was expecting more from the tool and personally I prefer the 2D version of the Map (see Figure 3), it is less graphically loaded, and the increase border or text size can be used to obtain the same visual contrast as in landscapes. 2D Maps have the advantage that they can be constructed using Visio or PowerPoint, two of the tools used by many IT professionals and managers.

In exchange, I would use a 3D Map for representing weighted Topics, in which cone's size would be proportional with its weight. Personal Topicscape, sample 2D Mind Map available with 3D TopicScape Pro Figure 3: Personal Topicscape, sample 2D Mind Map available with 3D TopicScape Pro

The site offers also a collection of more than 1000 Mind Maps which could give you a feeling what Mind Mapping is about. Actually from the TopicScape’s blog I found the link to a nice source for learning how to make a Mind Map.

04 June 2009

Technology x.0: Finally the Digital Book Reader

Yesterday my Sony PRS-700BC Digital Book Reader finally came, after two weeks and a trip overseas. I wanted so much a Digital Book Reader that I bought one, even if it doesn’t justifies entirely the price though might be useful when reading late in the evening or in trips in which is not possible to pack more than 1-2 books, not to forget the multitude of electronic documents not available in hardcopy. I was thinking to wait for Amazon’s Kindle DX, presented to the public a few weeks ago, unfortunately its (un)availability on European market and nice price made me to give up the idea of buying one. In exchange Sony’s reader looked more attractive as price and what attracted me at PRS-700BC was its touch-screen display and the possibility to add annotations and highlight text, these capabilities not being available in previous models. Using the stylus or direct touching, PRS-700BC allows you to select a piece of text (within the same page), save it and make it available in Notes section. 

I tested it using PDF documents and Sony’s proprietary format BBeB (Broad Band eBook), it worked acceptable as long the document is adequately formatted, the selection functionality working awkwardly in some PDF documents. The good rendering of PDF documents depends on font’s size, its length and disposal within page; even if font size is changed, the text might not be uniformly rendered, mathematical formulas being deformed, the text loosing of content. In order to avoid text’s deformation the text can be zoomed though I find the feature a little cumbersome to use for continuous reading. There would be also the possibility of exporting other documents to BBeB format, not sure if it really makes sense to do that…

Why am I talking about Digital Readers in this blog?! First of all because PRS-700BC provides the capability of annotating, highlighting and extracting text from a document, much of what we try to do with Web Pages within Web 2.0 in the attempt to create metadata and a read-write Web. The Notes thus created allow navigating back to the document it contains and in theory can be further used to partially index the document, partially because it doesn’t allows jumping between all occurrences like the search functionality. At it seems the full-word search provides hints based on previous annotations and highlights, that’s a nice feature.

I wonder whether the previously selected text can be also extracted on a PC in a document together with other information about the document that contains it; normally it should be possible, it’s just a question of programming effort. The text thus obtained could be reused in documents’ indexing or in Knowledge Maps. I hope that future models will have the capability of creating Maps inside the Reader and will that provide richer text formatting and processing.

Unlike Sony’s Reader, Kindle DX offers wireless connectivity which allows browsing directly Web Pages; Sony should consider doing the same! Just imagine that you can annotate Web pages on your own Reader, isn’t that something?! Of course, it won’t work so easy with heavy content Web Pages, though that’s a start… Anyway, Digital Readers are in their baby steps, there is more to be expected from the use of digital paper technology on which such devices are based. Let’s see what the future reserves us in this direction!

28 May 2009

🔖Knowledge Representation: Mind Maps

In 70’s Tony Buzan coined the term of Mind Map for his visual tool based on “radiant thinking” principle, cataloguing it as a “powerful graphing technique”, “expression of radiant thinking” or “a natural function of human mind”. He made public the concept in his first book on Mind Maps that appeared in 1974, “Use Your Head”, one year later appearing “The Mind Map Book”, over the years, if we give credit to [3], the number of books reached 85, being sold over 5 millions copies worldwide, in 100 countries and translated in 30 languages. Quite impressive, isn’t it?!

A Mind Map is centred on a single idea (in some sources referred as topic, subject, theme or question), other ideas being associated to it in a radial fashion, resulting in the end a Map of ideas, from here the alternative denomination of Idea Map. “Idea” is maybe a too general term because it can represent a thought, concept or a statement in which multiple concepts are used. In most of the Mind Maps met, ideas are expressed in the form of Key-Words, and sometimes of symbols or images, especially on digital Maps. A Key-Word is supposed to encapsulate “a multitude of meanings in as small a unit as possible” [1], thus ideas reach to be expressed as single words, each word being the label in a hierarchical network. Maybe an example will make some light, so supposing that “Happiness” is the central idea, we can associate to it words that we relate in our mind to Happiness: “family”, “good job”, “free time”, “money”, “love”, “vacation”, etc. Each of these ideas can be further extended with other associations, “family” could be associated for example with the name of “wife”/”wives”, “husband(s)”, “kid(s)”, “dog(s)”, “parents” and “grandparents”, “cat(s)” and any other pats we consider to be part of the family. A “good job” presumes “good remuneration”, “appreciation”, “good boss”, “nice colleagues”, “nice environment”, “potential”, etc. “Free time” could include all the activities somebody likes to have in his/her free time; same exercise can be done for each idea included in the Map, ideas can be associated over and over again with other ideas. It seems like a never ending story… when do we stop then? Most probably when the paper ends or we get bored, these are two possible answers too, in the end it’s up to each person, how detailed he wants the Map, what he/she wants to achieve, etc.

Happiness – Mind Map created with FreeMind Happiness – Mind Map created with FreeMind

A Mind Map can be regarded as a tree, in which the trunk represents the topic, the labelled leaves represent ideas, the forked branches themselves supporting the whole structure of the tree, their multiple forking representing the degree of detail the Map holds. The comparison with a tree is not accidental, tree-like drawings has been used since Antiquity to encode meaning (e.g. Tree of Life, Tree of Love), moreover representational purpose can be given also to the roots of the tree for example to represent base or fundamental ideas on which the whole foundation is built. Unlike trees, it could happen for example that two ideas from different braches can be associated too, for example “money” with “good job” resulting cross links between ideas. With each cross-links added the structure of the Map changes, becoming more like a network, though still relying on previous radial structure which becomes the Map’s backbone. Network-like Maps are more natural to represent knowledge, as knowledge has a networked rather than hierarchical structure.

A Map can go through multiple stages, iterations if you want, some ideas are deleted, others added, new associations are made, techniques are improved, and so on. Therefore such Maps are evolutional, they can change over time as people identify new associations, acquire new information or knowledge, change their values, change themselves and even their way of thinking…Excepting the radial disposition of ideas there are theoretically no other constraints, people can use their imagination and built all kind of Maps. Moreover, people can use visual rhythm, patterns, colour or spatial awareness (dimension and gestalt) to make Mind Maps easier to read, understand or navigate. Somebody can use his artistic talent and make a kind of piece of art from a Map, with a little imagination and skill a 2D Map can become 3D. In T. Buzan’s books you can find lot of propaganda for the use of Mind Maps and the benefits of its various characteristics together with references to (important) studies concerning learning and brain/mind theories.

A Map generally can be created by multiple people, the addition of ideas can be done independently or through consensus, the collective work can start from an idea, an already existing Map or the augmentation of all involved people’s Maps. Such collective or collaborative Maps can be used for example in learning or brainstorming, consensus playing an important role, and for example in a digital Map can be seen how the Map itself evolved and eventually also how the consensus was reached. [2] considers that there are 250 million Mind Mappers all over the world, jumping over the basis used for this consideration, even if their number raises up to several millions, that’s quite a number. Many Mind Mappers buy rich-functionality software tools for drawing digital Mind Maps, others resume to less rich functionality but free tools, they integrated the technique in everyday life, learning, teaching, presentations, decision-making, etc. It’s a form of knowledge representation, though the creation of Mind Maps is mainly for personal use, even if many Maps are available already in the public domain.

On the other side researchers occupy their time by building more or less complete ontologies, above their other characteristics, they imply consensus and quite an effort and coordination. Why not take advantage of the impressive number of Mind/Knowledge Mappers, give them rich and free software tools, and allow them to make explicit their knowledge or map the knowledge available on the Web?! Is the idea plausible?! How many of you haven’t underlined words or phrases of interest in a book or article creating thus bookmarks?! How many of you tried to built a mental image (Map) of how they fit together or into the existing knowledge? If we consider the “success” of folksonomies, of Knowledge Maps themselves, the increasing number of Web Sites and blogs on this topic, I am strongly convinced that the transition from folksonomies to Maps will happen pretty soon, once the Web Technologies in particular and Web’s evolution in general will allow that.

References:
[1] Buzan, T. (1991). Speed Reading. Ed: 3rd Plume. ISBN: 978-0452266049
[2] Buzan, T., Buzan, B. (2007). The Mind Map Book. BBC ACTIVE. ISBN: 978-1-406-6102
[3] Buzan.com.au. (2008). Tony Buzan. [Online] Available from: http://www.buzan.com.au/buzan_centre/tony_buzan.html (Accessed: 29 May 2009)

17 May 2009

🔖Knowledge Representation: Utilizing Mind Maps as a Structure for Mining the Semantic Web

In the past 2 and half years I followed the Online Masters Programme of University of Liverpool, it was intriguing, fun, time consuming and quite an effort as energy, money and personal life, and I hope it will pay back in time, the sooner the better. The modules were quite entertaining, I learn lot of new stuff and two years passed fast and slower than expected, then the dissertation came and things got pretty tough as I wanted to make it useful for me, to learn something meaningful on which I can built in the future and not something that will rot in a corner of the brain. I was not sure what to choose and frankly not even what I supposed to do.

During the last modules I had the chance to read some material on Tony Buzan’s Mind Maps and it looked intriguing, I wish I had have read that stuff long time ago, but in the end better later than never. Why I found Mind Maps intriguing? First because they allow taking notes in a radiant fashion rather than using the old fashioned linear approach, by starting with a single idea (also referred as concept, subject, question) and built around it a whole Map using associations. In Mind Maps Key-Words are used to encapsulate a variety of meaning in smallest possible units, this step allowing some information filtering and processing, “obligating” the brain to actually integrate the new information in existing knowledge and represent already existing knowledge, identifying missing links, triggering other questions, etc. Thus on a piece of paper or in a electronic document, somebody can represent how concepts in a read material link to each other, making the subject clearer and I think easier to memorize and recall. Mind Maps can be also used to give life to own mental representations, as we all have created, voluntarily or involuntarily and map of the world we live in. Secondly, Mind Maps use symbols and graphical images, visual rhythms and patterns, colour and spatial awareness (dimension and gestalt), allowing people to take advantage of a broader set of cortical skills.

Given these characteristics, Mind Maps seems to be perfect tools for Knowledge Representation in particular and Knowledge Management in general. During the Web Applications module I tangentially learned about XTM (eXtensible Topic Maps) and ontologies for Knowledge Representation, though ontologies call for experts and come with many issues, while XTM is a standard for Knowledge Interchange and targets internal representation in computers. On the other side digital Mind Maps are more flexible than ontologies, target a broader range of users, have the potential of harnessing the Collective Intelligence, one of Web 2.0’s competences, by allowing users to map their knowledge or the knowledge existing on the Web in documents. This is how appeared the title of my Dissertation paper, “Utilizing Mind Maps as a Structure for Mining the Semantic Web”.

While diving in the subject, I found out that Mind Maps are just one of the Knowledge Maps used for various tasks, a search trough the literature revealing about 50 terms used to designate various types of Maps: argument maps, brace maps , bridge maps, bubble maps, causal maps, circle maps, cluster maps, cluster vee diagrams, clustering, cognitive maps, concept circle diagrams, concept maps, conceptual graphs, congregate maps, diagnostic maps, double bubble maps, dynamic cognitive maps, ecological maps, extended fuzzy cognitive maps, flow maps, frames, fuzzy cognitive maps, fuzzy relational maps, group maps, historical maps, idea maps, knowledge maps, mental maps, mind maps, multi-flow maps, neural cognitive maps, neutrosophic cognitive maps, node-link mappings, ontology, oval maps, probability fuzzy cognitive maps, rule-based fuzzy cognitive maps, semantic maps, semantic nets, semantic networks, shared maps, social maps, social mess maps, spider maps, strategy maps, taxonomy, text graphs, thinking maps, tree maps and virtual maps. Actually, the list might be much bigger, I expect I left out by mistake several terms, while on others I haven’t came across them until now.

From several considerations, I preferred to treat the subject from the perspective of Knowledge Maps, so maybe a better title for my paper would have been “Utilizing Knowledge Maps as a Structure for Mining the Semantic Web”. As I found out later this cost me a huge amount of time and effort, I longed for more I could chew in the dedicated amount of time for a Dissertation paper, not having the time to bring the paper to the desired final form, letting out some research material and ideas. Anyway, now it’s over, good or bad the paper is finished and waiting for the final results. With this blog I’m hoping to bring into light some of the ideas I couldn’t put in the paper, help me do to further research into the subject and hopefully get also some feedback.

I’m not sure yet whether I can put the paper in the public domain, therefore here is paper’s Table of Contents, with the mention that some of the topics (e.g. Fuzzy Cognitive Map) have only an informative character.

1. The Web
1.1 Introduction
1.2 Web 2.0
1.3 The Semantic Web
1.4 Semantic Web Problems
1.5 Beyond the Semantic Web
1.5.1 The Noosphere
1.5.2 Cognitive Machines
2. Philosophical Grounds
2.1 Introduction
2.2 From Meaning to Concept
2.3 Syntax, Semantics and Pragmatics
2.4 From data to wisdom
2.5 Types of Knowledge
2.6 Connectivism
2.6.1 Introduction
2.6.2 Chaos
2.6.3 Network
2.6.4 Complexity
2.6.5 Self-organization
2.7 Intelligence and Collective Intelligence
2.7.1 Intelligence
2.7.2 Collective Intelligence
2.7.3 Collective Web Intelligence
2.7.4 Web Technologies and Collective Intelligence
2.7.5 Offline Collective Intelligence
2.7.6. Collective Intelligence Forms
3. Knowledge Management
3.1 Introduction
3.2 Knowledge Representation
3.2.1 Introduction
3.2.2 Sub-conceptual level
3.2.3 Symbolic level
3.2.3.1 Generalities
3.2.3.2 The Frame Problem
3.2.3.4 The Symbol Grounding Problem
3.2.4 Conceptual level
3.2.5 Associationist level
3.2.6 Semantic level
3.3 From Mental Models to Knowledge Representation Structures
3.4 Historical Overview
3.5 Vocabularies
3.5.1 Controlled Vocabularies
3.5.1.1 Introduction
3.5.1.2 Indexing Schemes
3.5.1.3 Classification schemes
3.5.1.4 Thesauri
3.5.1.5 Taxonomies
3.5.2 Uncontrolled Vocabularies
3.5.2.1 Introduction
3.5.2.2 Folksonomies
3.6 Maps
3.6.1 Introduction
3.6.2 Semantic Nets
3.6.3 Frames
3.6.4 Mind Maps
3.6.5 Conceptual Graphs
3.6.6 Concept Maps
3.6.7 Neural Networks
3.6.8 Cognitive Maps
3.6.9 Fuzzy Cognitive Maps
3.6.9.1 Fuzzy Cognitive Maps
3.6.9.2 Rule-Based Fuzzy Cognitive Maps
3.6.9.3 Extended Fuzzy Cognitive Maps
3.6.9.4 Dynamic Cognitive Networks
3.6.9.5 Neural Cognitive Map
3.6.9.6 Neutrosophic Cognitive Maps
3.6.9.7 Probability Fuzzy Cognitive Maps
3.6.9.8 Fuzzy Relational Maps
3.6.10 Knowledge Maps
3.6.11 Topic Maps
3.6.12 Ontologies
3.6.12.1 Ontologies
3.6.12.2 Ontology Engineering
3.6.13 Other Knowledge Representation Structures
3.7 Analyzing Maps
3.7.1 Structural Comparison
3.7.2 Map Engineering
3.7.3 Mapping Tools
3.8 Harnessing Collective Intelligence for Knowledge Mapping
4. Data Mining the Semantic Web
4.1 Web Data Mining
4.2 Document Processing
4.3 The Case for Knowledge Representation Structures as Metadata
4.4. The Conceptual Knowledge Base
4.4.1 Introduction
4.4.2 Representational Elements of a Map
4.4.3 Operations with Maps
4.5 Mapping Descriptive Knowledge with Maps
4.5 Concepts in Documents’ classification
4.5.1 Introduction
4.5.2 Concept-Based Information Retrieval
4.5.3 Concept-Based Document Classification
5. Conclusions, Critics and Further Research
6 Appendix
6.1.Acronyms:
6.2 References:

20 April 2009

🕸️Web x.0: Web's evolution - Part 1

The Web 2.0 term was proposed by Tim O’Reilly in conference brainstorming session between O'Reilly and MediaLive International, in which he envisioned several competencies. With the new versioning the old fashioned Web, as we know it, became Web 1.0, while in the literature were mentioned other two versions - Web 3.0 for the Semantic Web and Web 4.0 for the Noosphere. There are many people who are not comfortable with the version addressing of the Web, on one side it doesn’t seem natural, while on the other side it’s the easiest manner to encompass the set of characteristics or philosophies in the smallest unit of meaning.

The transition between the different versions is occasionally marked with vague comparisons in which are reflected two or three characteristics, some of them are fixed, while other dependent on authors’ expectations. Into the below table I tried to put together some of the characteristics of what each Web version is about, there are still blank spaces, there are even wild guesses about what the future might bring. The table is not perfect, but it summarizes somehow my understanding about Web’s expectations.
 

Dimension Web 1.0 Web 2.0 Web 3.0 (Semantic Web) Web 4.0 (Noosphere)
User participation read only read-write collaborate human-machine collaboration
Intelligence Individual Intelligence Collective Intelligence Swarm Intelligence Artificial Intelligence*
Content creation companies communities ecologies human-machine ecologies
Content focus owning sharing aggregating reasoning
Indexing directories/taxonomies folksonomies Knowledge Maps Large Language Models*
User expression home pages blogs/webcasts social networks ?
DIKW focus data information knowledge wisdom
Macro-focus document centric content centric knowledge centric wisdom centric
Content accessibility Web forms Web Services meshups semantic applications
Content presentation web sites portals meshup aggregations ?
Content structuring HTML XML XML programming-based aggregation XML concept-based aggregation
Vector-based graphics applets RIA RIA 2 semantic RIA
Ads advertising pay-per-click ? ?
Information access searching subscription (to services) contextual filtering prompt engineering*
Knowledge structure taxonomies ontologies networks Lego-like networks
Data mining emphasis Web logs behavior concept-based pragmatic
(*) Updared Dec-2025

Probably one major drawback of the above table is that it had no timeline associated with each stage, though it got right the importance of AI in term of collaboration, forming of ecologies, the importance of semantics, reasoning and "wisdom". 

18 April 2009

🕸️Web x.0: The Semantic Web (Part I: An Introduction)

Even if I’m just a newbie in Semantic Web and Semantic Technologies, in the past months I had the chance to give some thought to this idea. The way I see it, the Semantic Web targets to make content processable and understandable by machines, and not necessarily targets, at this stage, to evolve the Web to a space of “machine reasoning”, in which machines can replace human reasoning with comparable results. This state of art won’t be achieved also in the next foreseen stage, named Noosphere by a few Web theoreticians, for example [1]. 

The Noosphere, formed from nous (mind) and sphere (space or circle), can be regarded as a “space of human thought” supposed to reflect in real time the dynamics of collective intelligence, the role of visualization (reflection) and aggregation tools being essential. In time, I suppose that machines will grow (in) intelligence, being more and more capable to handle various tasks more like humans. When this will happen?! Who knows… Along the time the world’s theoretical models barriers were pushed beyond previous existing limits, so everything is possible, even braking the barriers of Goedel’s incompleteness theorems.

The Semantic Web is just a stage in the evolution of the Web, same as Web’s versions, it reflects a new way of thinking about Web, its role, expectations and tools supposed to fulfill them. Each person or community can have its own expectations and way of approaching the Semantic Web, lot of effort being spent in different directions, reinventing the wheel, technologies that die soon after they were born. Most of the researchers consider ontologies as the backbone on which the Semantic Web has to be built, many technologies focusing on this perspective. There are also scientists who question the achievability of a Semantic Web or the role of ontologies in this picture. C. Shirky’s [2], supported also by P. Gaendenfors [3], sustains that “the Semantic Web is a machine for creating syllogisms” and therefore it will improve only the areas that uses syllogistic reasoning. 

Conversely, ontologies are just islands of knowledge not anchored in reality, they offer only a view/map of the world, and even if they reflect the commitment to common agreement, they are not a commitment to completeness. Ontologies are supposed to be created mainly by experts, involve high costs, considerable effort and coordination, and it seems that they follow the fallacies of OOP programming, breaking apart in their own complexity and require redesign when new facts are brought into the picture or the scope changes. As new knowledge is acquired or the requirements changes, the work on ontologies never ends, ontologies matching and integration involving other type of issues. Even more, to make things even fuzzier, M.K. Gergman [4] mentions more than 40 information structures that have been labeled in one way or another as ontology – tag cloud, controlled vocabulary, topic map, concept map, etc. Another important aspect neglected by ontologies seems to be the fuzzy nature of truth, while other issues derive from the information representational structure problems: symbol grounding problem, frame problem [5] and contextual emergence [6].

The goal of the Semantic Web is to “get people to use more meta-data” [2], and why not to create metadata, of harnessing the Collective Intelligence, as [7] formulates it. It has started with wikis and folksonomies, and might continue with more complex annotations, for example Knowledge Maps. It is created thus a layer of connectivity on top of physical structure of the Web Graph.

From my point of view Web theoreticians focus on high level goals and ignore the immediate needs of the users, which are often excluded from the Semantic Web equation. Models and technologies that target only the scientific world (e.g. ontologies) have low chances to make a difference in the Web space. The Web users need (free) tools that can be used for metadata creation, collaboration, information processing, knowledge mapping and diffusion. At least in the near future machines won’t achieve the thinking performances of humans about the world, though maybe once the Web riches the state of a Semantic Web, things would be much simpler.

References:
[1] Levy, P. (2005). From Cyberspace to Noosphere. [Online] Available from: http://www.minervaeurope.org/events/parma/papers/levy_ppt.ppt (Accessed: 26 January 2009)
[2] Shirky, C. (2003). The Semantic Web, Syllogism, and Worldview. [Online] Available from: http://www.shirky.com/writings/semantic_syllogism.html (Accessed: 7 February 2009)
[3] Gaerdenfors, P. (2004 B). Conceptual Spaces as a Framework for Knowledge Representation. [Online] Available from: http://www.mindmatter.de/mmpdf/gaerdenfors.pdf (Accessed: 9 January 2008)
[4] M.K. Gergman. 2009. ‘Structs’: Naïve Data Formats and the ABox.[Online] Available from: http://www.mkbergman.com/?p=471(Accessed: 17 April 2008)
[5] Duch, W. (1995) From cognitive models to neurofuzzy systems - the mind space approach. [Online] Available from: http://www.fizyka.umk.pl/publications/kmk/95sams.pdf (Accessed: 13 January 2009)
[6] Atmanspacher, H., Foundation, P., beim Graben, P. (2005). Contextual Emergence of Mental States from Neurodynamics. [Online] Available from: http://www.igpp.de/english/tda/pdf/potsdama12.pdf (Accessed: 13 January 2009)
[7] O’Reilly, T. (2005). What Is Web 2.0: Design Patterns and Business Models for the Next Generation of Software. [Online] Available from: http://www.oreillynet.com/pub/a/oreilly/tim/news/2005/09/30/what-is-web-20 (Accessed: 18 April 2009)
Related Posts Plugin for WordPress, Blogger...